
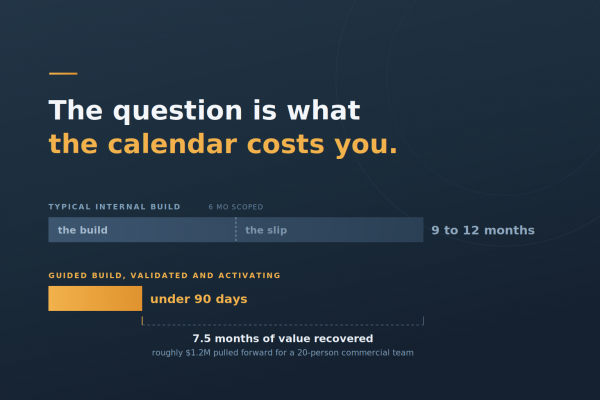
The question is not whether you are capable. It is what the calendar costs you.
Nearly every value program conversation now reaches the same moment. A CRO, a VP of Enablement, or a Value Leader leans back and says some version of the following: with AI, we can build this ourselves.
They are right. That is worth saying plainly, because the reflexive consultant answer is to argue the point, and arguing it is both wrong and unpersuasive. You have smart people. You have AI that can draft messaging, build models, and generate content at a speed that was not available eighteen months ago. The capability question is settled.
The questions that actually decide the outcome are different. How long will it take. Whether it is built on anything solid. And what happens to the revenue you were going to earn in the meantime.
Six months is almost never six months
Here is the pattern we see repeatedly. A team scopes an internal value program build at six months. It lands somewhere between nine and twelve.
The slip is not incompetence. It is arithmetic. The people who would build it also carry quota support, QBRs, a pricing change, a product launch, and a board deck. Value program work is important and almost never urgent, which means it loses every calendar collision to something with a date attached.
The independent research on internally built AI-assisted initiatives is not encouraging. RAND found that more than 80 percent of AI projects fail, roughly twice the already-high failure rate of IT projects that do not involve AI, based on interviews with 65 experienced data scientists and engineers. MIT’s 2025 GenAI Divide report, directional rather than definitive, put 95 percent of enterprise generative AI pilots at zero measurable P&L impact.
Notice what is not in the diagnosis. Not model quality. Not talent. The recurring causes are unclear ownership, objectives that drift, no change management, and metrics that measure activity instead of outcomes.
Those are the exact failure modes of an internal value program build.
Most programs get built on a shoddy foundation
The delay is the visible problem. This one is more expensive and much harder to see.
Internal builds almost always start in the middle. Someone needs a business case for a deal, so a calculator gets built. The calculator needs value drivers, so drivers get chosen from whatever product benefits are already in the pitch deck. Now there is a model. It produces a number. The number has three decimal places and no foundation underneath it.
That is building the roof first. And the failure mode is nasty, because the output looks credible right up until a buyer’s finance team asks where the driver came from.
Value Communication comes first for a reason. ICP clarity, then the company value narrative, then industry and persona value stories, then the content and playbooks that carry them. Only then does quantification have anything legitimate to stand on: identify the customer’s actual value drivers, build the models, frame the business case and shared value plan, and scale it.
Get that order wrong and every asset downstream inherits the flaw. Your calculator will compute the wrong benefit with impressive precision. Your sellers will quantify an outcome the buyer’s executive team does not own. Your marketing will claim value that customer success cannot later prove.
There is also a stakeholder problem a product-derived model cannot solve. Gartner’s survey of 632 B2B buyers found that 74 percent of buying teams show unhealthy conflict during the decision process, with members holding conflicting objectives, while groups that do reach consensus are 2.5 times more likely to report a high-quality deal. A single ROI number aimed at one persona does nothing for that room. Persona-level value stories are what give sellers something to say to each of them.
So before anyone opens a spreadsheet: go back to the roots. Validate the positioning and the messaging framework. Then build outward. Teams that skip this step do not save time, they move the rework to month eight.
Content and tools are the easy part, and they are not the expensive part
BCG’s guidance on AI transformation is a 10-20-70 allocation: roughly 10 percent of effort on algorithms, 20 percent on technology and data, and 70 percent on people and processes. Their more recent work reinforces it. In BCG’s Build for the Future x AI 2025 global study, only about 5 percent of organizations achieved substantial financial gains from AI, and that group posted three-year total shareholder returns roughly four times higher than AI laggards. What separated them was not better technology. It was how they changed the way people worked.
Map that onto a value program and the picture gets uncomfortable.
Value messaging, quantification models, business case templates, ROI and TCO calculators, and playbooks are the 10 and the 20. AI genuinely accelerates that layer, and if a team tells me they can produce those artifacts faster than they could two years ago, I believe them.
Value Activation is the 70:
Enablement and training that changes what sellers actually do under pressure, rather than what they can recite. Coaching and reinforcement from frontline managers who inspect for value in deal reviews instead of nodding at it. Value expert support for the deal that needs help on a Tuesday afternoon, not in next quarter’s training cohort. And value strategy and governance, so the whole thing has an owner, a cadence, and consequences.
None of that is a content problem. All of it is a behavior problem, and behavior change does not respond to speed of production. A perfect value framework nobody uses returns exactly zero.
Every internally built program I have seen stall had finished artifacts sitting in a content library.
The harder gap: not knowing what good looks like
The second thing internal builds underestimate is definitional. Teams know they need “value selling.” Very few can describe what a mature value capability actually contains, in what order it gets built, or how they would know they were making progress.
So they build what they can see. Usually that is a calculator and a deck. Both are real assets. Neither is a program.
The Value-Led Growth Maturity Model exists to remove that guesswork. It defines three pillars, Communicate, Quantify, and Activate, across eight capabilities: Strategy and Governance, People, Attract, Engage, Sell, Retain and Expand, Tools and Data and Technology, and Intelligence and Optimization. It then places you on six stages, from Reacting and Aspiring through Constructing, Operationalizing, Composing, and Orchestrating.
The benchmark data is where this gets pointed. Across 122 organizations, average maturity sits at 2.1, which is Constructing. The strongest capabilities are Attract at 2.9 and Sell at 2.7. The weakest are Retain and Expand at 1.5 and Intelligence and Optimization at 1.3.
Read that shape carefully, because it is the exact shape of an unguided internal build. Organizations get reasonably good at positioning value and justifying the deal, then fall off a cliff on activation, realization, and feedback loops. Value is front-loaded. It gets sold and then it resets, forcing teams to re-sell it at every renewal instead of compounding it.
That is not a content gap. It is a sequencing and ownership gap, and it is invisible to a team building from intuition rather than a map.
Meanwhile the market is not waiting. At the 2026 Gartner CSO conference, nearly 8 in 10 sales leaders named getting sellers to quantify value instead of pitching product as their top concern. McKinsey’s November 2025 research found that companies with the most sophisticated value realization practices post net revenue retention roughly 7 percentage points higher than peers with basic practices, and that only 18 percent of surveyed executives were operating at that level.
Now change one variable: what if it took under three months?
Set aside the build-versus-buy argument for a moment and ask a sharper question.
What if, in under 90 days, you had the foundation validated, the full element set built across all three pillars, third-party research backing your claims, customer validation on the value drivers themselves, and activation already underway with your first cohort of sellers?
Not artifacts in a library. Capability in market, being used, with proof behind it.
That turns the decision from a cost comparison into a timing calculation, and the timing calculation is not close.
The illustrative math for a 20-person commercial team
Swap in your own numbers. The structure is what matters.
Assume 20 commercial team members carrying $1.2M each, so roughly $24M in annual team revenue against about $120M of pipeline at a 20 percent win rate.
Now apply improvements set deliberately far below the 20 to 50 percent gains documented for value-led organizations across win rates, deal size, cycle time, renewal loss, and expansion revenue:
- Win rate up 2 points, from 20 to 22 percent, a 10 percent relative lift: about $2.4M
- Average deal size up 4 percent on the base: about $960K
- Discounting reduced by 2 points of realized price: about $480K
Call the annual run-rate benefit roughly $3.8M, or about 16 percent on a $24M base. Cut it in half if you want to be hard on yourself. It still lands near $1.9M a year.
Here is the part that decides it. Compressing from a 10.5 month midpoint to under 3 months recovers about 7.5 months of that benefit in year one. At the halved figure, that is roughly $1.2M pulled forward. At the full figure, closer to $2.4M.
And it does not stop there. Every month you shift the curve left, you keep. The benefit does not arrive later, it arrives earlier and then compounds from a higher base in year two.
Against that, weigh what the internal build actually costs: fully loaded time from your value, enablement, and marketing people over nine to twelve months, the projects they were not doing instead, and an honest probability that the whole thing stalls at month eight when a reorg or a product launch takes the calendar.
For a 20-person team, the delay is worth multiples of the acceleration. For a 100-person team, the comparison stops being a discussion.
Which reframes the decision entirely. It was never build versus buy. It is build alone versus build with a map:
What genuinely should stay in-house. Your value story ownership, your customer data, your account relationships, your credibility with your own sellers. Nobody outside can own these, and nobody should try.
What a proven pattern accelerates. The framework and maturity sequence, the model architecture that has survived a CFO before, the third-party research vetting, the customer validation approach, the activation and coaching design, and the pattern recognition for what fails and why. This is where paying for experience compresses the calendar rather than replacing your team.
Where to be honest with yourself. If value program work has no named owner with protected capacity, it will slip. Every time. That is not a resourcing prediction, it is an observation about how quarters work.
Where to start
If you are weighing an internal build right now, start with the map rather than the vendor conversation.
The Value-Led Growth Maturity Model white paper lays out the three pillars, the eight capabilities, the six maturity stages, and the benchmark data from 122 organizations, along with what to prioritize at each stage. Read it before you scope the project. It will either sharpen your build plan or show you which parts you were about to skip.
Get the white paper: https://geniusdrive.com/the-value-led-growth-maturity-model/
Then take the rapid self-assessment to see where you land against the benchmark. If the gaps look material, schedule a deep dive review. We work through your current maturity by capability, whether your foundation is solid enough to build on, a realistic timeline given actual capacity, and what the delay is worth in your own numbers. No pitch. If the honest answer is that you should build it yourself, you will leave with a better plan for doing exactly that.
You can build it. The only question worth arguing about is when it starts producing revenue.
Let’s discuss your program and the math to determine the best build vs. buy strategy: Click here to schedule a consultation with us.
Sources:
More than 80 percent of AI projects fail, roughly twice the failure rate of IT projects that do not involve AI. Based on interviews with 65 experienced data scientists and engineers. RAND Corporation, The Root Causes of Failure for Artificial Intelligence Projects and How They Can Succeed, 2024. https://www.rand.org/pubs/research_reports/RRA2680-1.html
Approximately 95 percent of enterprise generative AI pilots showed no measurable P&L impact, with roughly 5 percent extracting significant value. Preliminary and not peer-reviewed, best treated as directional. MIT Project NANDA, The GenAI Divide: State of AI in Business 2025, July 2025. https://finance.yahoo.com/news/mit-report-95-generative-ai-105412686.html
74 percent of B2B buying teams show unhealthy conflict during the decision process, while buying groups that reach consensus are 2.5 times more likely to report a high-quality deal. Survey of 632 B2B buyers, August to September 2024. Gartner, May 2025. https://www.gartner.com/en/newsroom/press-releases/2025-05-07-gartner-sales-survey-finds-74-percent-of-b2b-buyer-teams-demonstrate-unhealthy-conflict-during-the-decision-process
The 10-20-70 rule: 10 percent of AI transformation effort on algorithms, 20 percent on technology and data, and 70 percent on people and processes. BCG, The Leader’s Guide to Transforming with AI, 2025. https://www.bcg.com/featured-insights/the-leaders-guide-to-transforming-with-ai
Only about 5 percent of organizations have achieved substantial financial gains from AI, and that group shows three-year total shareholder returns roughly four times higher than AI laggards. BCG, Build for the Future x AI 2025 Global Study, via AI Transformation Is a Workforce Transformation, 2026. https://www.bcg.com/publications/2026/ai-transformation-is-a-workforce-transformation
Average Value-Led Growth maturity of 2.1 (Constructing) across 122 organizations, with Attract at 2.9 and Sell at 2.7 against Retain and Expand at 1.5 and Intelligence and Optimization at 1.3. Documented improvements for value-led organizations range from 20 to 50 percent across win rates, deal size, sales cycle length, renewal loss, and expansion revenue. Genius Drive, The Value-Led Growth Maturity Model, 2026. https://geniusdrive.com/the-value-led-growth-maturity-model/
Companies with the most sophisticated value realization and adoption journeys achieve roughly 7 percentage points higher net revenue retention than peers with basic practices, and only 18 percent of surveyed executives operate at that level. Survey of more than 100 commercial, revenue, sales, and customer success leaders across 98 US B2B SaaS companies. McKinsey, November 2025. https://www.mckinsey.com/industries/technology-media-and-telecommunications/our-insights/the-net-revenue-retention-advantage-driving-success-in-b2b-tech
Nearly 8 in 10 sales leaders named getting sellers to quantify value instead of pitching product as their top concern. Gartner CSO Conference 2026, via Genius Drive analysis. https://geniusdrive.com/
Note: The 20-person commercial team calculation is illustrative, built from stated assumptions rather than survey data, and is intended to be re-run with the reader’s own pipeline, win rate, and deal size.